Portfolio at Risk
Introduction
Portfolio at risk or PAR is the type of ratio that usually is used in microfinance institutions or banks to measure the quality of loans and the risk that they currently have. PAR is important when we need to analyze or measure the risk in percentage that our loans may go default if we properly breakdown the loans and group them in similar risk categories.
Portfolio at risk is usually calculated by using the amount of loan outstanding that is overdue comparing to total loan. However, sometimes, the number of loan client is also used to calculate this ratio.
Portfolio at Risk Formula
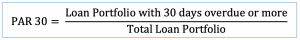
We can calculate portfolio at risk or PAR with the formula of using the amount of loan portfolio that is overdue from a certain period onward, e.g. 30 days, to divide with the total loan portfolio.
Sometimes, we may need to calculate PAR 30 using clients in the portfolio at risk formula. In this case, we need to change our formula from “loan portfolio” to “loan client”.

***We may also need to calculate PAR 60 days or 90 days. In this case, we need to change the above formula from 30 days to 60 days or 90 days.
Portfolio at Risk Example
For example, ABC Ltd. which is a microfinance institution has USD 9,013,400 of the total amount of loan portfolio and a detailed loan by overdue days as in the table below.
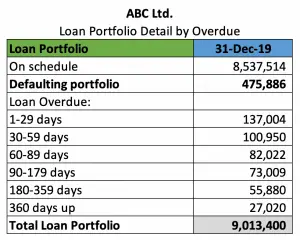
Calculate PAR 30 days, PAR 60 days and PAR 90 days for the above loan portfolio.
Solution:
With the information in the portfolio at risk example above, we can calculate PAR 30, PAR 60 and PAR 90 as below:
PAR 30:
Loan portfolio at risk with 30 days overdue or more = 100,950 + 82,022 + 73,009 + 55,880 + 27,020 = 338,882
PAR 30 = 338,882/9,013,400 = 3.76%
PAR 60:
Loan portfolio at risk with 60 days overdue or more = 82,022 + 73,009 + 55,880 + 27,020 = 237,931
PAR 60 = 237,931/9,013,400 = 2.64%
PAR 90:
Loan portfolio at risk with 90 days overdue or more = 73,009 + 55,880 + 27,020 = 155,909
PAR 90 = 155,909/9,013,400 = 1.73%
The excel calculation of portfolio at risk as well as the form and data in the picture of portfolio at risk example above can be found in the link here: Portfolio at risk calculation excel
Portfolio at Risk Analysis
In the portfolio at risk analysis, we mainly use PAR to measure how much risk that our loan portfolio has in percentage compared to our total portfolio. The term risk in this ratio refers to the risk that the loan’s clients may not pay or not be able to pay back the loans that we provided them.
To make it easy in analysis, portfolio at risk is usually measured by using PAR 30 days, in which “30” refers to the loan portfolio that is overdue 30 days or more. However, we may also use PAR 60 days or PAR 90 days to have a better picture of the quality of loans we have. This is why when we calculate PAR, there’s always the number of days behind the word “PAR” e.g. PAR 30, PAR 60 or PAR 90.
Additionally, we may also breakdown down the loan by location, size, product type or sector in order to have a detailed analysis of the loan quality when calculating PAR ratio. Together with the trend analysis by comparing PAR ratios from one period to another, we can measure the risk that the loans have and take proper action in order to increase the quality of the loans.
What is the meaning of PAR
The meaning of portfolio at risk or PAR will be easier to understand when combining the number of overdue days such as 30, 60, or 90 days. In this case, when we see a certain percentage of the PAR 30, it means that we have a certain percentage of the total loan portfolio that the client’s payment has been overdue or late for 30 days or more.
So, the higher PAR means the more loans or bigger amounts of loans that are late in payment. Hence, the bigger risk that the loan portfolios are at.
As in the portfolio at risk example above, PAR 30 equal 3.76% means that there is 3.76% of the total loan of USD 9M which is equal to USD 338,882 that is late in payment for 30 days or more. Since most companies use PAR 30 as a cutoff between bad loans and good loans, we can say that we have 3.76% bad loans and 96.24% good loans among the USD 9M loan portfolio.
Summary
In general, we can estimate how much in percentage our loan will default when we have sufficient information to calculate portfolio at risk in detail, e.g. by breaking down loans into the small segments. Hence, the PAR ratio can help us to make the decision on future loan disbursement, especially decisions on pricing to reflex the risk that the future loan disbursement may expose to.
Of course, much more information and analysis such as 5Cs analysis will probably be required before we can provide a loan to the client. However, portfolio at risk can at least give us a rough idea of how much risk we will have in a specific location, size, product type or sector if we use it properly.