Scatter Graph Method
Scatter Graph is the mathematical graph that use a cartesian coordinate system to display the value of two variable arrive from a set of data. There will be a set of points display in the graph, then we draw a straight line close to those points.
In cost accounting, the Scatter Graph is used to separate the fixed and variable costs from the mixed cost. We use this method to calculate the total cost at different activity levels. Then draw the line alongside the visual spot, the line will use to estimate the fixed and variable cost. Fixed cost is the exact point where the line meets Y-axis, it represents the cost when production zero. The total variable is calculated by subtracting fixed costs from the total mixed cost.
Scatter Graph Formula
Y: total cost
a: total fixed cost
b: variable cost per unit
x: unit production
Process of Scatter Graph Method Calculation
| Process of Calculation | |
|---|---|
| 1. Build the graph | Place the level of production (units) on X-axis and the total cost on Y-axis. |
| 2. Put data into the graph | Calculate the total cost at the different production levels and put them into the graph. |
| 3. Draw the line | Draw the line which minimizes the distance between all the points. Extent it to the Y-axis. |
| 4. Total fixed cost | Fixed cost the point where the line meets with Y-axis. |
| 5. Variable cost | The variable cost can be calculated by picking to the exact point and using the following formula: b = (y2-y1)/(x2-x1) It is the same as the high-low formula. |
Example
Company A has incurred mix cost during the production of one specific product as following:
| Month | Units | Total cost |
| 1 | 625 | 19,000 |
| 2 | 875 | 20,875 |
| 3 | 800 | 21,180 |
| 4 | 1,175 | 27,540 |
| 5 | 1,050 | 24,050 |
| 6 | 1,500 | 29,500 |
Use the scatter graph to separate the fixed and variable costs.
- Build the graph
The X-axis will represent the number of products from Jan to June. It will start from 625 units to 1,500 units.
- Put the data
All the data must be put into the graph, each point represents the number of units produces and the total cost spend.
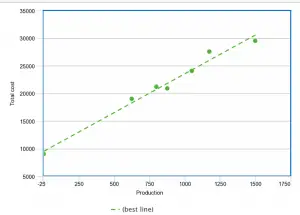
- Draw the line
We draw the line which is in between all the lines.
- Fixed cost
Fixed cost is equal to $ 9,000 which is the spot that the line meets Y-axis.
- Variable Cost
Variable cost = (Y2-Y1)/(X2-X1)
= (29,500 – 9,000)/(1,500 – 0)
= 13.66 per unit
Limitation
- The line is not really present the actual situation. Sometimes it even far from the truth.
- This method will not be applicable when step costing involves, as it assumes the cost will increase as the production increase. However, in real life, the step cost may happen where it increases significantly at a certain production level.