Investor Ratios
What are Investor Ratios?
Investor ratios are the financial ratios that the investors use in order to evaluate the company’s ability to generate the return for their investment. In general, investors usually want to know which one is a good company to invest their money in, in accordance with their risk appetites. In this case, investor ratios can provide the information which shows the company’s health and its ability to provide the return to investors for the risks involved in their investment.
Investor ratios are usually used in comparing to the prior period or other company in the same industry in order to evaluate the company’s ability and its performance in generating the return back to investors.
The commonly seen investor ratios include earnings per share (EPS), price-earnings ratio (P/E ratio), dividend cover and dividend yield.
Earnings per Share (EPS)
Earnings per share (EPS) is the financial ratio that looks at the bottom line of the company’s income statement, which is net income, compared with the total number of shares the company has. Likewise, it shows users the company’s ability and strength to generate profit. Investors usually use earnings per share as an indication of the company’s performance. In general, the higher earnings per share is the better the company’s performance is.
The trend in earnings per share over time can be helpful for investors to make a decision whether to buy share of the company in the capital market. However, the company may retain a significant proportion of the fund it generates. This will lead to an increase of retained earnings and result in the increase of earnings per share even if the company’s profitability does not increase.
EPS Formula
Earnings per share can be calculated by comparing the net income after tax and preferred dividends during the period to the total ordinary shares at the end of the period.

Price Earnings Ratio (P/E Ratio)
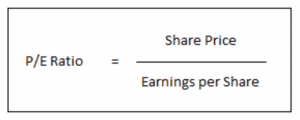
P/E ratio is the financial ratio that looks at how much it costs to own a share in the company compared with the benefits or earnings generated from that share. Likewise, it shows the relationship between the company’s share price and its earnings per share (EPS).
P/E ratio is commonly used as an indication of the company’s value placed by the capital market. It reflects the assessment of both risks and rewards in buying the company’s share in the market.
P/E Ratio Formula
P/E ratio can be calculated by comparing the current share price to the earnings per share.

Dividend Cover
Dividend cover is the financial ratio that looks at the amount of time the company can pay out the dividends to its shareholders by comparing the company’s net income to the dividend paid. Likewise, it shows the company’s ability to pay dividends out of its attributable profit to the shareholders. In general, the higher the dividend cover ratio is the better it is for the shareholders, as it indicates the lower risk that they will not receive dividends in the future.
Dividend Cover Formula
Dividend cover can be calculated by comparing the net income after tax to the dividends declared or paid.

Dividend cover can also be calculated by comparing the earnings per shares (EPS) to the dividend per (ordinary) share.

Dividend Yield
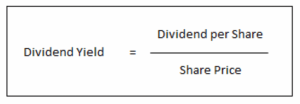
Dividend yield is the financial ratio that provides a direct measure of the return on investment in the shares of the company by comparing dividend per share to the market price per share. Likewise, it shows the relationship between the dividend and the market price of the company’s share.
Dividend yield is one of important factors that is commonly used by investors to make a decision in buying or selling shares in the capital market. In a similar way, investors usually use the dividend yield to assess the relative benefits of different investment opportunities in the capital market.
Dividend Yield Formula
Dividend yield can be calculated by comparing the dividend per share to the share price.
