Balance Sheet Ratios Formula and Example
Definition
Balance sheet ratios are the ratios that analyze the company’s balance sheet which indicate how good the company’s condition in the market. These ratios usually measure the strength of the company comparing to its peers in the same industry.
The ratios are also used in comparing to the previous periods to analyze the company’s condition over time; whether it is improving or getting worse.
The ratios calculation includes various types of balance items, such as cash, inventory, receivables, liabilities, and equity, etc.
12 Types of Balance Sheet Ratios
The twelve balance sheet ratios below can be calculated with the formula using financial statements of the company that is usually available in the annual report or on its website.
| Types of Balance Sheet Ratios | |||
|---|---|---|---|
| No | Ratio | Formula | Description |
| 1 | Current Ratio | Current Assets / Current Liabilities | This ratio analyzes the company’s liquidity by using its current asset to pay the current liability. |
| 2 | Quick Ratio | (Current Assets – Inventory) / Current Liabilities | This ratio analyzes the company’s liquidity by using its current asset which excludes inventory to pay the current liability. This is due to the inventory may take some time to convert to cash. |
| 3 | Cash Ratio | Cash and Cash Equivalent / Current Liabilities | This ratio analyzes the company’s ability to pay its short-term liability in the stress situation where its inventory won’t sell and its receivables won’t be able to be collected in a short period of time. |
| 4 | Receivables Turnover | Net Credit Sales / Average Receivables | This ratio measures how fast the company can collect payment from its receivables. |
| 5 | Days Sales Outstanding | (Receivables / Credit Sales) x 365 | This ratio measures how long the company takes in days to collect payment from its receivables after the sales have been made. |
| 6 | Doubtful Account | Allowance for Doubtful Accounts / Receivables | This ratio analyzes the quality of the company’s receivables. It is usually used by auditors in the examination of receivables. |
| 7 | Inventory Turnover | Cost of Goods Sold / Inventory | This ratio measures how many times the company sold and replaced its inventory during the period |
| 8 | Days Inventory Outstanding | (Inventory / Cost of Goods Sold) x 365 | This ratio measures how long the company takes in days to sell its inventory. |
| 9 | Payables Turnover | Purchases / Average Payables | This ratio measures how many times the company pays its payables during the period. |
| 10 | Days Payable Outstanding | (Payables / Cost of Goods Sold) x 365 | This ratio measures how long the company takes in days to pay back its payables. |
| 11 | Debt-to-equity Ratio | Liabilities / Equity | This ratio analyzes the company’s financial leverage which indicates how much debt the company uses comparing to its equity in running the business. |
| 12 | Debt-to-asset Ratio | Liabilities / Assets | This ratio analyzes the company’s financial leverage which indicates how much debt the company uses comparing to its total assets. |
Balance Sheet Ratios Example
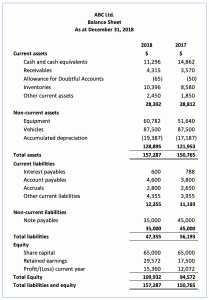
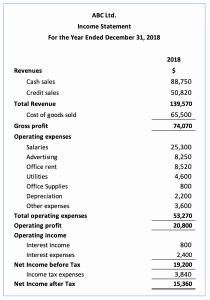
For example, we have the balance sheet and income statement of the company ABC Limited as below.


With the example above, calculate the twelve balance sheet ratios for the company ABC Limited.
Calculate Balance Sheet Ratios
With the balance sheet and income statement in the example above, we can calculate the balance sheet ratios as below:
| Current Ratio | = 28,392 / 12,355 | = 2.30 |
| Quick Ratio | = (28,392-10,396) / 12,355 | = 1.46 |
| Cash Ratio | = 11,296 / 12,355 | = 0.91 |
| Receivables Turnover | = 50,820 / (4,315 + 3,570)/2 | = 12.89 |
| Days Sales Outstanding | = 4,315 / 50,820 x 365 | = 31 |
| Doubtful Account | = 65 / 4,315 | = 1.51% |
| Inventory Turnover | = 65,500 / 10,396 | = 6.30 |
| Days Inventory Outstanding | = 10,396 / 65,500 x 365 | = 58 |
| Payables Turnover | = *76,316 / (2,800 + 2,650)/2 | = 25 |
| Days Payable Outstanding | = 4,600 / 65,500 x 365 | = 26 |
| Debt-to-equity Ratio | = 47,355 / 109,932 | = 43.08% |
| Debt-to-asset Ratio | = 47,355 / 157,287 | = 30.11% |
*Purchases = Ending Inventories – Beginning Inventories + Cost of Goods Sold
= 10,396 – 8,580 + 65,500 = 76,316