Simulation models (The Monte Carlo Simulation)
Simulation models help the management to make a decision when there are many uncertain variables included in the situation. This method will provide an impact on our business when more than one variable changes.
In real business, there are many variables that can change our expected outcome. Those factors will not be under our control such as political, cultural change, new technology, new competitors, and so on. Any change in these factors will impact our more or less our business. So the management wants to see the impact and set a strategy to reflect with these uncertain.
Moreover, it is also a model to help company to evaluate and select the best project to invest in. Due to a limited fund, we want to invest in the most profitable investment. So this model is very helpful in this situation. It can cooperate both cost and revenue of various projects and compare the profit of all projects in different probability.
Simulation models will generate a random change of variables and show each impact on the outcome. It also estimates the most probable outcome that can happen so management can select the best profitable project to invest in.
Example of Simulation models
Company is considering producing new product X. Based on the survey, we expect the sale as following the probability.
| Sale | Probability |
| 200,000 | 20% |
| 600,000 | 40% |
| 700,000 | 30% |
| 800,000 | 10% |
The R&D cost will be incurred as the following:
| R&D Cost | Probability |
| 100,000 | 30% |
| 150,000 | 50% |
| 220,000 | 20% |
Then we need to apply the number to both revenue and expense. It would be done as follows:
| Sale | Probability | Assign number |
|---|---|---|
| 200,000 | 20% | 00-19 |
| 600,000 | 40% | 20-39 |
| 700,000 | 30% | 40-89 |
| 800,000 | 10% | 90-99 |
| R&D Cost | Probability | Assign number |
| 100,000 | 30% | 00-29 |
| 150,000 | 50% | 30-79 |
| 220,000 | 20% | 80-99 |
Each assign number represents its range of revenue and R&D cost.
Then we use the computer to pick up a series of random numbers such as 08, 24, 58, 90, 29, 57, 82.
Based on these random numbers, we can come up as below:
| Random number | Sale | R&D Cost | Sale – R&D Cost |
|---|---|---|---|
| 08 | 200 | 100 | 100 |
| 24 | 600 | 100 | 500 |
| 58 | 700 | 150 | 550 |
| 90 | 800 | 220 | 580 |
| 29 | 600 | 100 | 500 |
| 57 | 700 | 150 | 550 |
| 82 | 700 | 220 | 480 |
This figure will tell how often the cost and sale change at random. It will be more helpful when we are comparing multiple projects for investment.
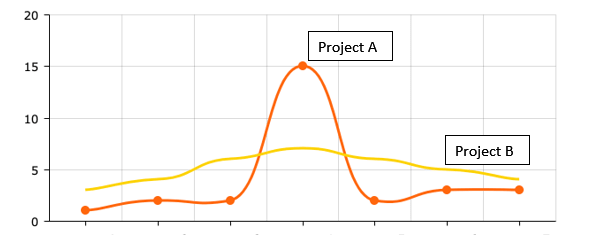
Project A will have a chance to generate higher profit, however, there is a chance that it is lower than project B. If it misses the best opportunity ($ 15m), it will make less than $ 5m in profit that is less than project B.
Project B can make only around $ 5m profit, and there is a low chance that It goes below that.
Advantage of Simulation model
- It shows the correlation between input and outcome of each point. The management can check any result they prefer by looking at the graph.
- We can use it to predict the result with multiple variables changing at the same time. By doing so, it will be more practical, as the changes in real life are not limited by any factors.
- It can provide multiple sensitivity analyses. The management will see both positive and negative impacts on the project.
Disadvantages of Simulation model
- It is not giving the best decision
As we can see, the system will tell us all the possible outcomes of each project. And the choice depends on us. It cannot tell which one is better. It just simulates all the possible outcomes which can happen, but we are not sure about the probability. They are outside of our control, so the model just shows them but not sure about the likelihood of happening.
- Very complicate
The system will need to use the computer to generate a complicated random number.
- Depending on the probability
It depends on the likelihood, anything wrong with it, the system will be useless.
- Cost vs. benefit
The benefit of this method is very low if compared to the time spent and the complexity of it.