Decision Tree in Management Accounting
 Decision tree is the diagram that shows all the possible actions which we can do to solve a particular problem. Each action taken will lead to a different result base on the probability outcome. This graph contains risk, reward, and probability of various actions taken.
The tree consist of many decision points with possible outcome associated with, we will be able to see the connection between one decision to another. It will show us the whole picture so that we can select the best possible outcome.
Construction Decision Tree
Draw the tree from left to right, and we start with the question which we want to select. Then draw to the possible outcome which bases on the probability. The probability and result maybe get from other sources such as surveys and market research or the history data.
Evaluating Decision Tree
- Calculate an expected value (EV) at each outcome point
The expected value (EV) will calculate by multiply the outcome with each probability.
- Choose the best option at each decision point
We will select the decision point, which has the highest EV. However, we only have two options, which is the decision point on the left-hand side so that we will select one of these two options.
When we use the Decision Tree
The decision tree can use with the following condition:
- Strategic Decision
- Tactical Decision
- Operational Decision
Decision Tree Example
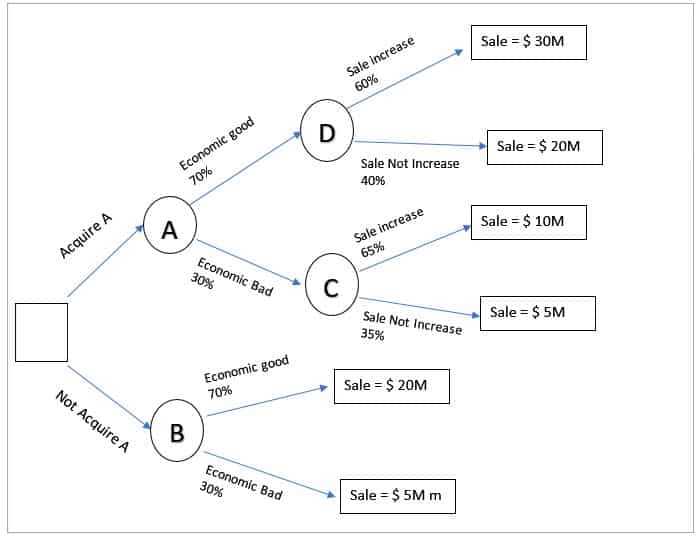
Group company Z is preparing to purchase Company A in Asia in order to increase revenue by directly sell its products. The revenue will change bases on Economic stability in the region as well. Based on the market research, we have some information as below:
- If the economy is good, the sale will be around $ 20 million without acquiring Company A. There is a 70% chance that the economic condition is good.
- If the economy is bad, the sale will be around $ 5million without acquiring Company A. There is a 30% chance that the economy is bad.
- If we acquire Company A and the economy is good, there is 60% chance that the sale will increase to $ 30 m.
- If we acquire Company A and the economy is bad, there is 65% chance that the sale will only $ 10m.
The profit margin of Group company Z is 20% for Asia.
Using the decision tree and recommend whether we should acquire Company A or not.
Solution
Construct the decision tree
- We draw the diagram from the left to the right
- Squire is representing the decision point in which we are deciding to acquire company A or not.
- The circle is the chance point
Evaluate the Decision Tree
- 1. EV of point D: (60% * 30M) + (40% * 20M) = $ 26M
- 2. EV of point C: (65% * 10M) + (35% * 5M) = $ 6.5175M
- 3. EV of point B: (70% * 20M) + (30% * 5M) = $ 15M
- 4. EV of point A: ((70% * 26M) + (30% * 6.51M) = $ 20.15M
In conclusion, we should choose point A, which recommends acquiring the Company as it will generate revenue of $ 20.15M. It is higher than point B (not acquire).
Note: Do not confuse with the higher EV of point D. Here we have only two options A & B (Acquire or not), we cannot decide on the economic condition.
Disadvantages of decision tree
The probability
The prediction may have some errors that will impact our expected value. The whole system will not work as expected.
Complexity
This is one of the tools which is easy to use after someone has complete it. However, building a decision tree is very complicated and time-consuming. It will very hard and confusing when there is more option to involve in the decision tree.